When the pandemic hit, I used my data analysis and Google Sheet skills to inform

Without a doubt, COVID-19 has impacted every aspect of life, especially higher education. Earlier this year, the University of Arizona (UofA) announced it would start the Fall 2020 semester in a hybrid mode of in-person and online instruction, and had prepared for this re-entry in a number of ways. One of those priorities is testing of students, staff, and faculty to identify active cases. The UofA was not alone, as many other universities had implemented their own COVID-19 testing program.
In late August, the UofA provided summary data containing new daily tests (for the previous day) and cumulative numbers (July 31–) on their main COVID-19 Updates webpage. Over time, it was clear that the numbers were not improving, but I grew frustrated as it was difficult to see quantitative trends. Prior to the start of the semester, it was said during a COVID-19 webinar that the COVID-19 dashboard would be made available in late August. So on September 3, I decided to start an independent volunteer project where I started to aggregate the summary data. I announced it on Twitter, and started with whatever screenshots I had saved and began putting the information in a Google Sheet, which I made publicly available for everyone to see. Over time, I had the help of a few UofA colleagues that connected with me through social media:
- Jill McCleary, Deputy Director and Acting Head at UofA Museum of Art
- Cheryl Knott, Professor in the School of Information
- Santiago Castiello-Gutiérrez, Ph.D. candidate in the Higher Education program
I am so thankful to them as this project would not have been possible without them.
I chose Google Sheet for many reasons:
- Easy to use
- Easy to publish
- Easy to collaborate
- Easy to make charts/graphs
- As a programmer, built-in version control
This project was very much #openscience as hundreds of users checked out the spreadsheet daily to look at the latest updates. Since many users viewed it anonymously, it was hard to get exact numbers, but this was what I found from Twitter, Google, and Bitly tracking.
- I estimate a total of 545 clicks on either the original Google or Bitly link
- 393 (72%) of those clicks were through Twitter and Facebook
- The spreadsheet was shared via other platforms (SMS, email, etc.) for nearly 152 additional clicks (28%)
- There were 146 unique non-anonymous viewers to the Google Sheet
- Using Bitly, I was able to see that viewers included those in at least ten different foreign countries.
This all happened mostly during a nearly two-week period before the COVID-19 dashboard went live on September 16.
The source of information came from my colleagues, UofA's weekly re-entry broadcasting, and using the WayBackMachine to go back and look at the websites. After all the data were aggregated, there was a lot of quality control as some numbers disagreed, and that needed to be recorded in the Google Sheet with in-cell comments and source identification. This is what we call good data management practice. A preview of the machine-readable consolidated spreadsheet is available below:
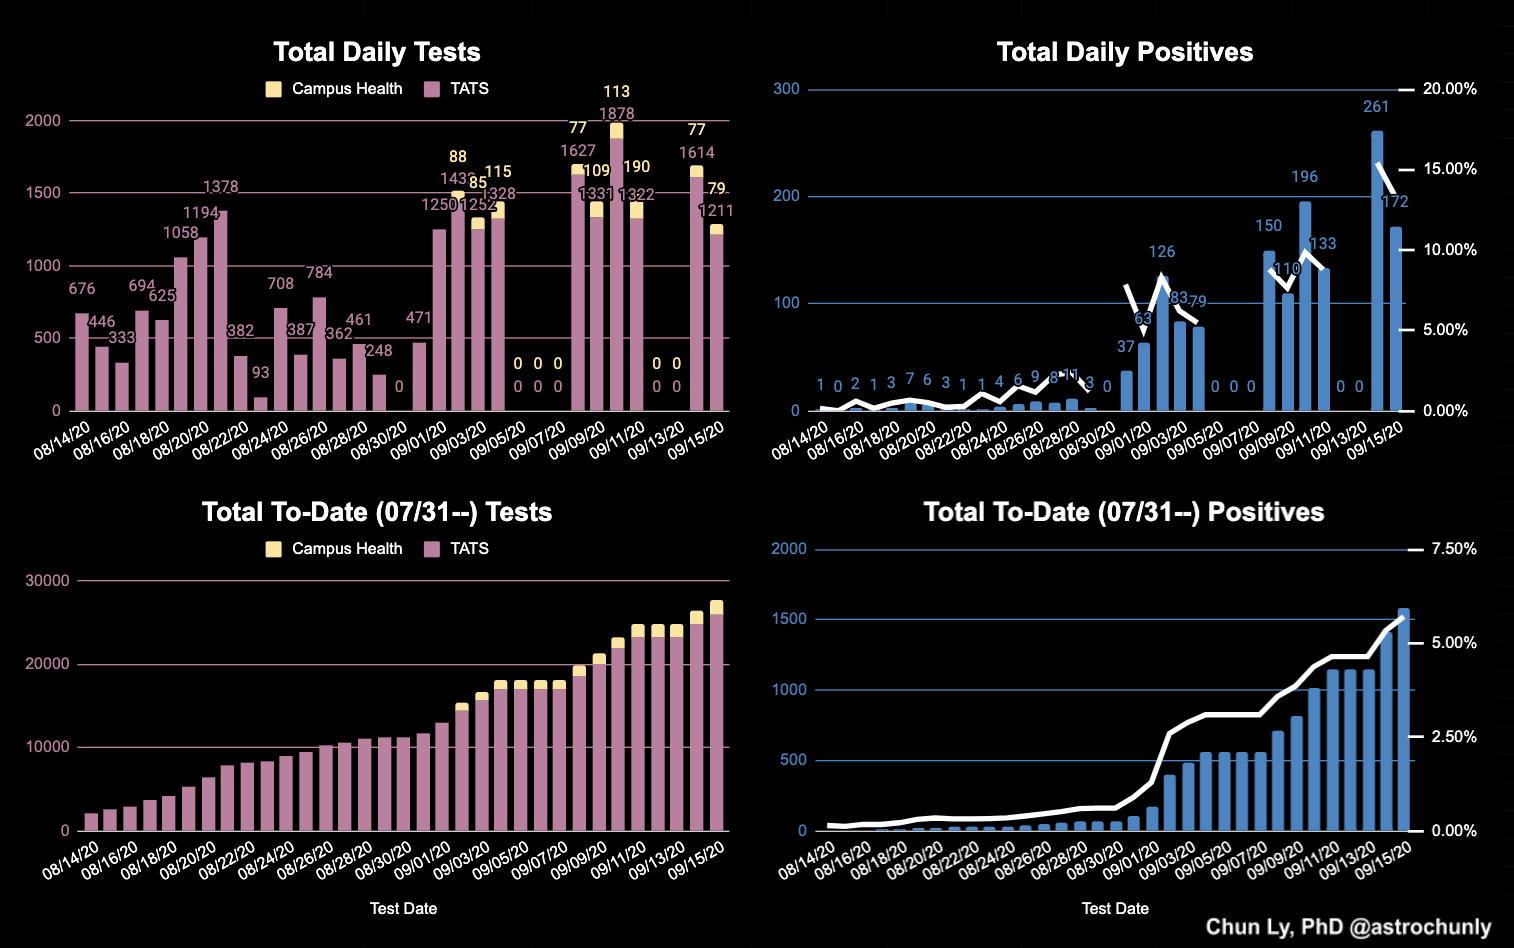
Then, after I felt confident of all the numbers, I put together graphs that summarized the testing data.
The final culmination of this hard work by my colleagues and I is publishing the final table and visualization in the UofA Research Data Repository. The work is titled “Independent Data Aggregation, Quality Control and Visualization of University of Arizona COVID-19 Re-Entry Testing Data” and is made available under a Creative Commons Zero (CC0) public domain license:
Final Thoughts
I really enjoyed being able to share what I learned with the UofA community. I found myself needing to make this happen so everyone knew how fast COVID-19 was spreading in the UofA community. We all need to pull together to fight back, and gathering, checking and illustrating information was the best way for me to go about it.
#StaySafe, #BearDown, and #MaskUp!