Building a streamlit app to serve UArizona salary data and deploying it on Heroku

Motivation
The Daily Wildcat of the
University of Arizona (UArizona) has routinely provided
the salary of UArizona employees for nearly a decade through public requests.
While this allowed for the easy viewing of information for an individual,
the analysis from the Daily Wildcat was rather limited. As such, I wanted to
build a data visualization app that would allow anyone to explore the data for
100% transparency. I call it sapp4ua, which is short for the
salary app for UArizona. It's available at https://sapp4ua.herokuapp.com
How
The salary data were available as machine-readable CSV files, so it made sense
to build a Python application that uses pandas to extract, transform, and
load (ETL) the data. I heard about streamlit, a Python web framework that
would make it faster to build such an app. Essentially streamlit provides a
RESTful application programming interface (API) with a front-end layer that
interacts with Python scripts that do data analysis and visualization. It
took me about a weekend to understand streamlit and its “widgets”, which
are interactive tools that could be used to perform ETL actions with the data.
From there, I put together the software to load the data and provide different
“data views” that were different interactions with the data. The code is
available on GitHub
under an MIT License. There are many resources and blogs about building a
streamlit app, so I won't go in details here, but I will illustrate some
aspects:
Loading in data can be simple.
import pandas as pd
import streamlit as st

# List of fiscal years
FY_LIST = [
    'FY2019-20', 'FY2018-19', 'FY2017-18', 'FY2016-17',
    'FY2014-15', 'FY2013-14', 'FY2011-12',
]


@st.cache
def load_data():

    file_id = {
        'FY2019-20': '1d2l29_T-mOh05bglPlwAFlzeV1PIkRXd',
        'FY2018-19': '1paxrUyW1wZuK3bjSL_L7ckKEC6xslZJe',
        'FY2017-18': '1AnRaPpbRTLVyqdeqe6vkPMYgbNnw9zia',
        'FY2016-17': '1rXBuuXit5oWKtfnA05gsNtsWAyESeIs2',
        'FY2014-15': '1ZANVDr6Kw40MJYiOENWbLMTFEMWyf7f4',
        'FY2013-14': '1rQ8A2CIVhDYu0lESKVh72h6VUd8gIEFl',
        'FY2011-12': '1fQOzEHiOvc_H1NcLMlK3KVV1DJkRbRuX',
    }

    data_dict = {}
    for year in FY_LIST:
        data_dict[year] = pd.read_csv(
            f'https://drive.google.com/uc?id={file_id[year]}'
        )

    return data_dict


def main():

    # Load data
    data_dict = load_data()
The above code loads each previous year of available data into a dict
of pandas DataFrames. The st.cache decorator ensures that the data is
loaded into memory only once. This ensures a shorter response time when it's
deployed and users are accessing the app frequently. Here, I made the data
publicly available in Google Drive. I could have gone with an SQL server,
but given the small record sizes (~10,000 records), and the reliability
of Google Drive, this worked well for an MVP.
To select from the data, I utilized streamlit sidebar widgets to add the
layer for selection. For example, the following selects the data for one
year:
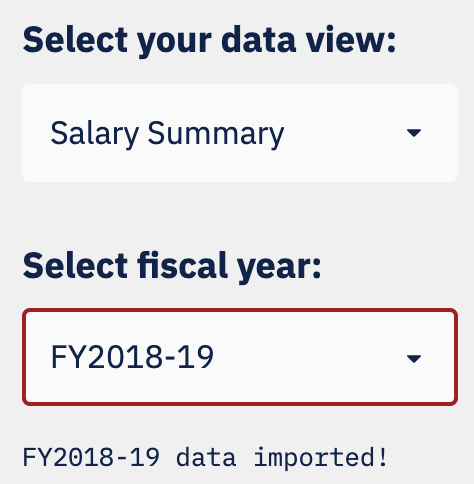
def select_fiscal_year() -> str:
    """Sidebar widget to select fiscal year"""

    st.sidebar.markdown('### Select fiscal year:')
    fy_select = st.sidebar.selectbox('', FY_LIST, index=0).split(' ')[0]

    return fy_select


def main():
    # Load data
    data_dict = load_data()

    fy_select = select_fiscal_year()

    # Select dataframe
    df = data_dict[fy_select]
    st.sidebar.text(f"{fy_select} data imported!")
This results in something that looks like this:
As discussed earlier, interactions with the data is done with different views. Currently, I have six of them:
- Trends: General facts and numbers (e.g. number of employees, salary budget), for each fiscal year.
- Salary Summary: Statistics and percentile salary data, includes salary histogram.
- Highest Earners: Extract data above a minimum salary.
- College/Division Data: Similar to Salary Summary but extracted for each college(s)/division(s).
- Department Data: Similar to Salary Summary but extracted for each department(s).
- Individual Search: Search for all data for individuals or by looking at each department. You can read more here.
This can easily be done on the sidebar and then the main page is loaded:
DATA_VIEWS = [
    'About', 'Individual Search (NEW)', 'Trends', 'Salary Summary',
    'Highest Earners', 'College/Division Data', 'Department Data',
]

def select_data_view() -> str:
    """Sidebar widget to select your data view"""

    st.sidebar.markdown('### Select your data view:')
    view_select = st.sidebar.selectbox('', DATA_VIEWS, index=0)

    return view_select


def main():
    # Sidebar, select data view
    view_select = select_data_view()

    if view_select == 'About':
        views.about_page()

    if view_select == 'Trends':
        views.trends_page(data_dict, pay_norm)

    if view_select == 'Salary Summary':
        views.salary_summary_page(df, pay_norm)

    if view_select == 'Highest Earners':
        views.highest_earners_page(df)

    # Select by College Name
    if view_select == 'College/Division Data':
        views.subset_select_data_page(df, COLLEGE_NAME, 'college',
                                      pay_norm)

    # Select by Department Name
    if view_select == 'Department Data':
        views.subset_select_data_page(df, 'Department', 'department',
                                      pay_norm)

    # Load individual search
    if view_select == 'Individual Search':
        views.individual_search_page(data_dict, unique_df)
Here views is a Python module and each function displays
different content in the main page. Here's a screenshot for the
Salary Summary page:
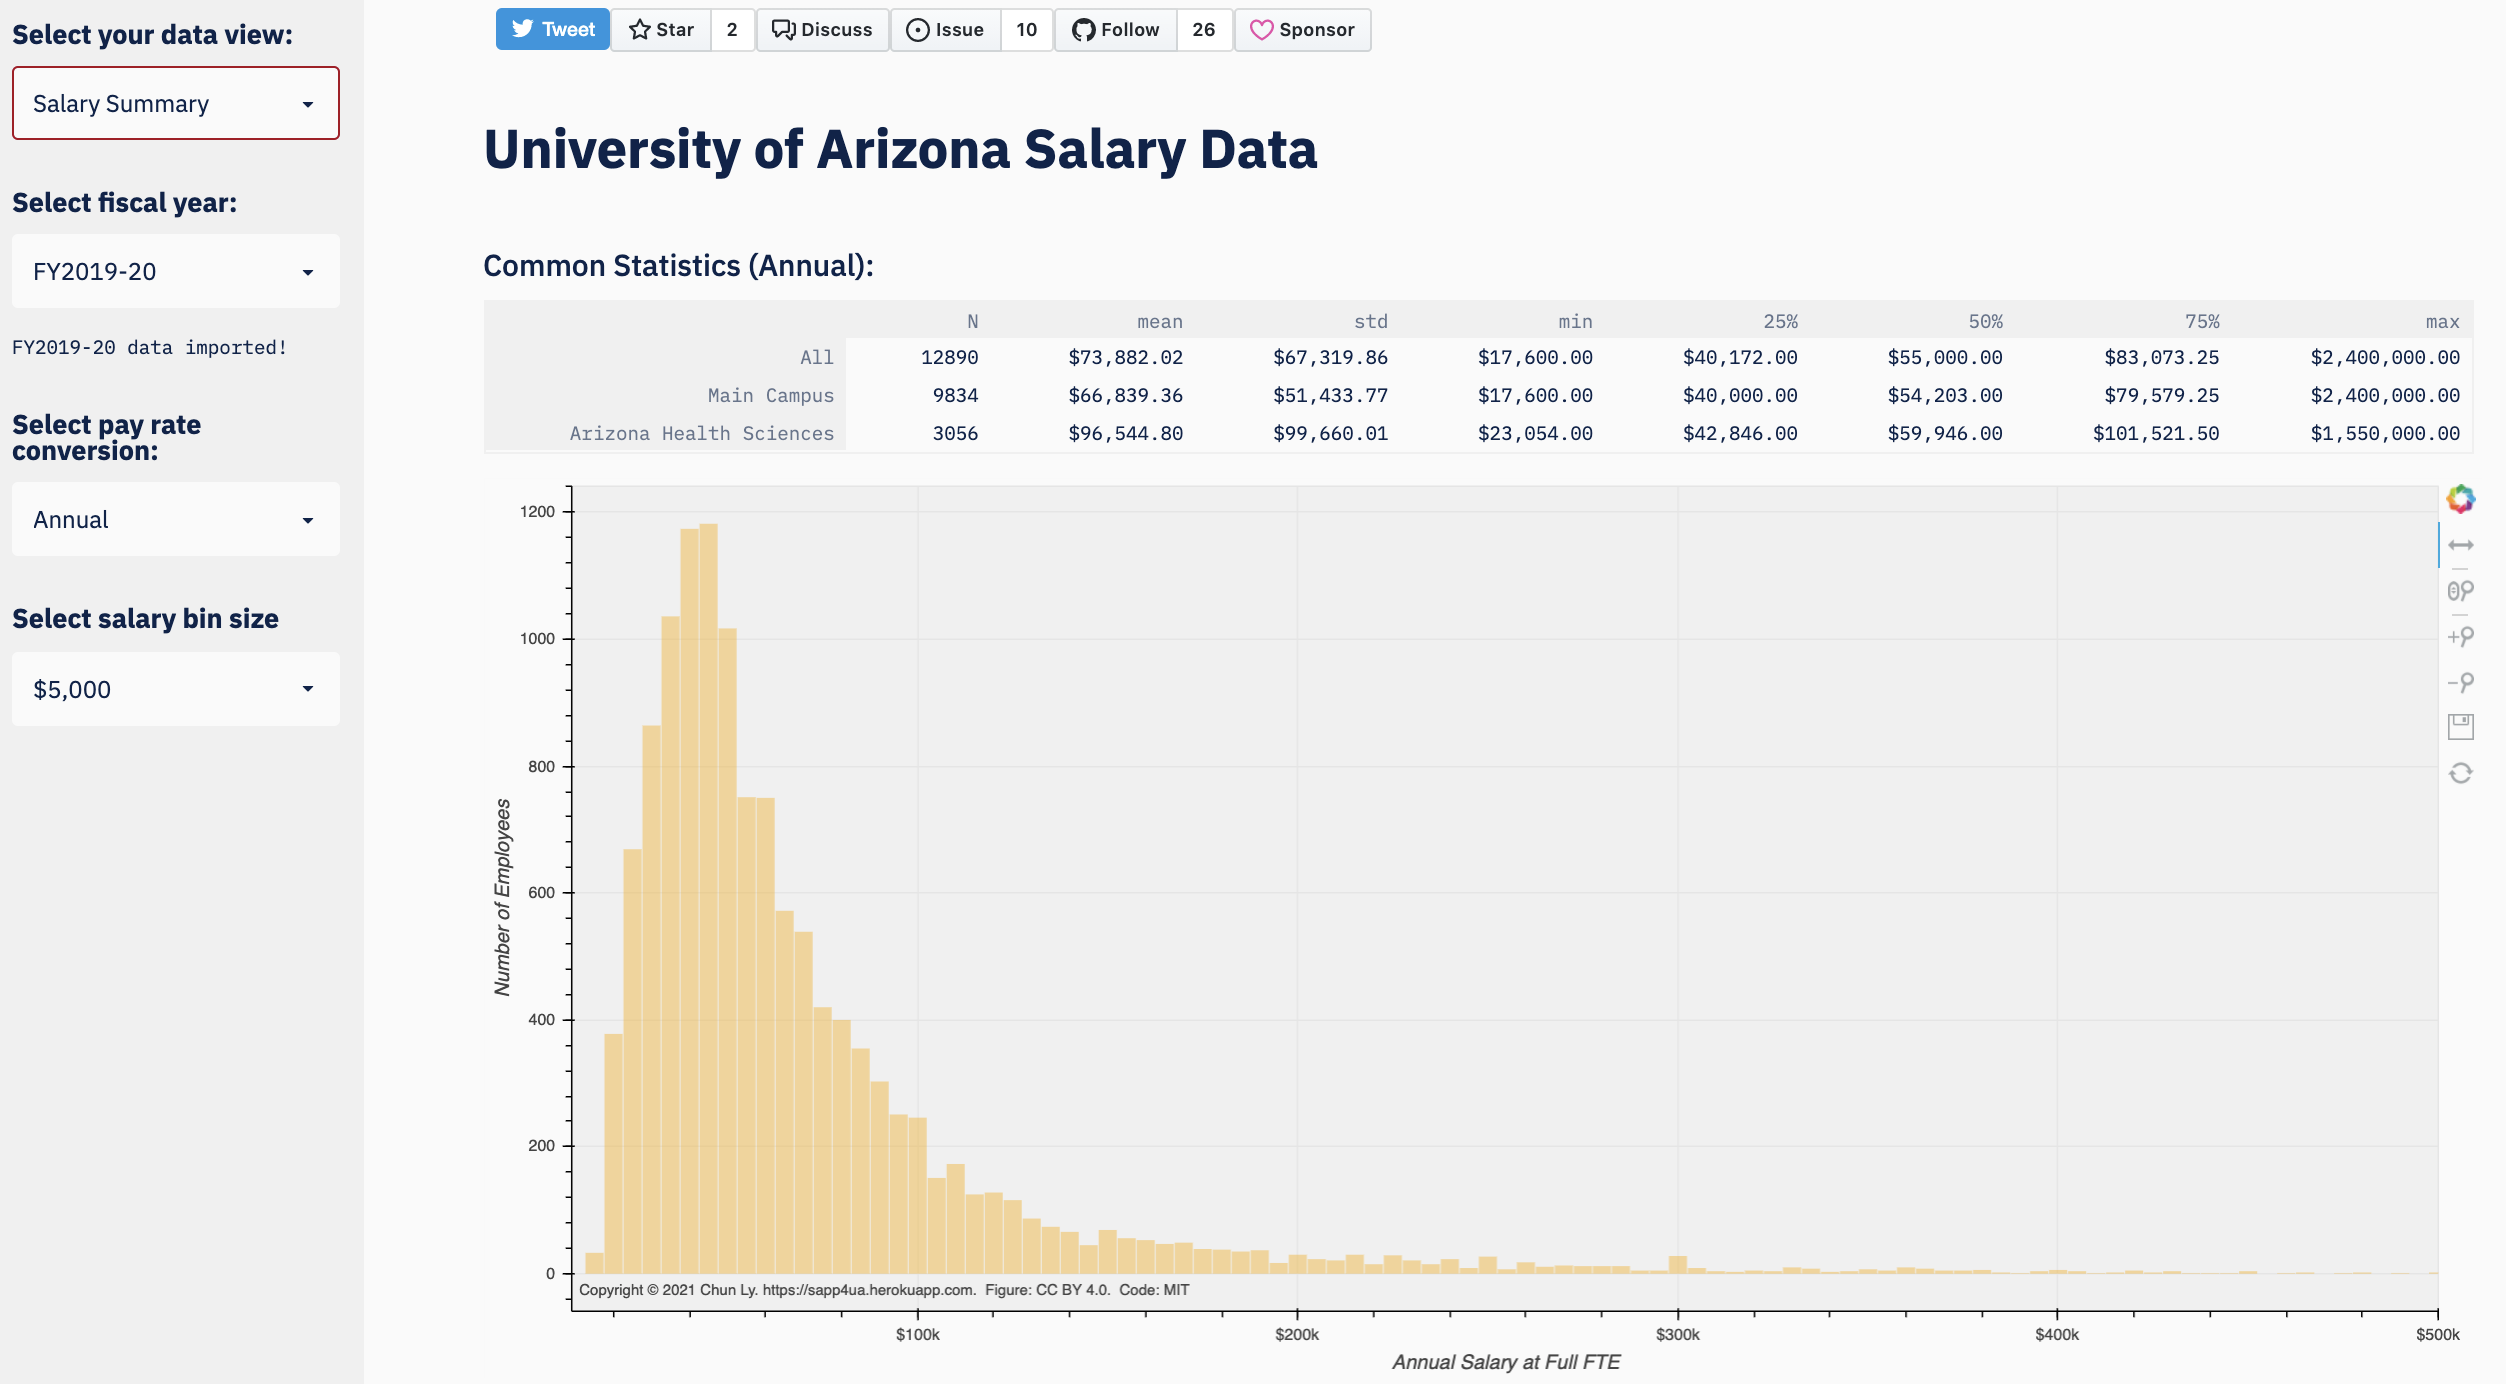
sapp4ua.
Deploying it on Heroku
With a functional app, it's easy to have it locally deployed with the following command:
streamlit run salary_app/main.py
To make it available on a production instance, I looked into hosting services
(called Platform as a Service), and it turned out that
Heroku has a free tier for serverless deployment.
It seems as though it's one of the popular options among streamlit users to
deploy their apps. Note that streamlit runs a web server so static
site hosting services (e.g., GitHub Pages) will not work. To get started,
first sign-up for a Heroku account. To create
your first Heroku project, select the “Create New App” option from the New
button. Here the project name needs to be unique across all of Heroku
because it will point to https://<project-name>.herokuapp.com.
Now you have a project that can be triggered to deploy after any codebase changes. What I learned is that Heroku is developer friendly. It has at least three ways to deploy it:
- Manually using
git - Using GitHub integration
- Using a GitHub Action
Command-line deployment
For the first method, this follows a git workflow for deployment. In
short you create a git remote locally, login with the heroku cli, and
push changes to the Heroku git repo. An update to the remote triggers
a deployment and within a minute or two your app is publicly available!
There's more information available here in the
Heroku docs.
My steps were a bit different as I had already created a Heroku project
through the UI and already had a local .git repo. I simply got the Heroku
git URL through the Settings menu for the project; it should look like:
https://git.heroku.com/<project-name>.git
Now all you need to do is add it as a git remote in your local .git repo:
git remote add heroku https://git.heroku.com/<project-name>.git
You will need to install the
Heroku CLI (heroku) and
login: heroku login. After that is done, you deploy with a push:
git push heroku main
Continuous deployment
The above step is great if you're learning to deploy your app for the first time. However, this step is manual and it's tedious as you make improvements to your app.
Heroku has a couple of options for continuous deployment (CD). The first of which is GitHub integration. Through the Heroku UI, the “Deploy” menu for the project has configuration settings for deployment.
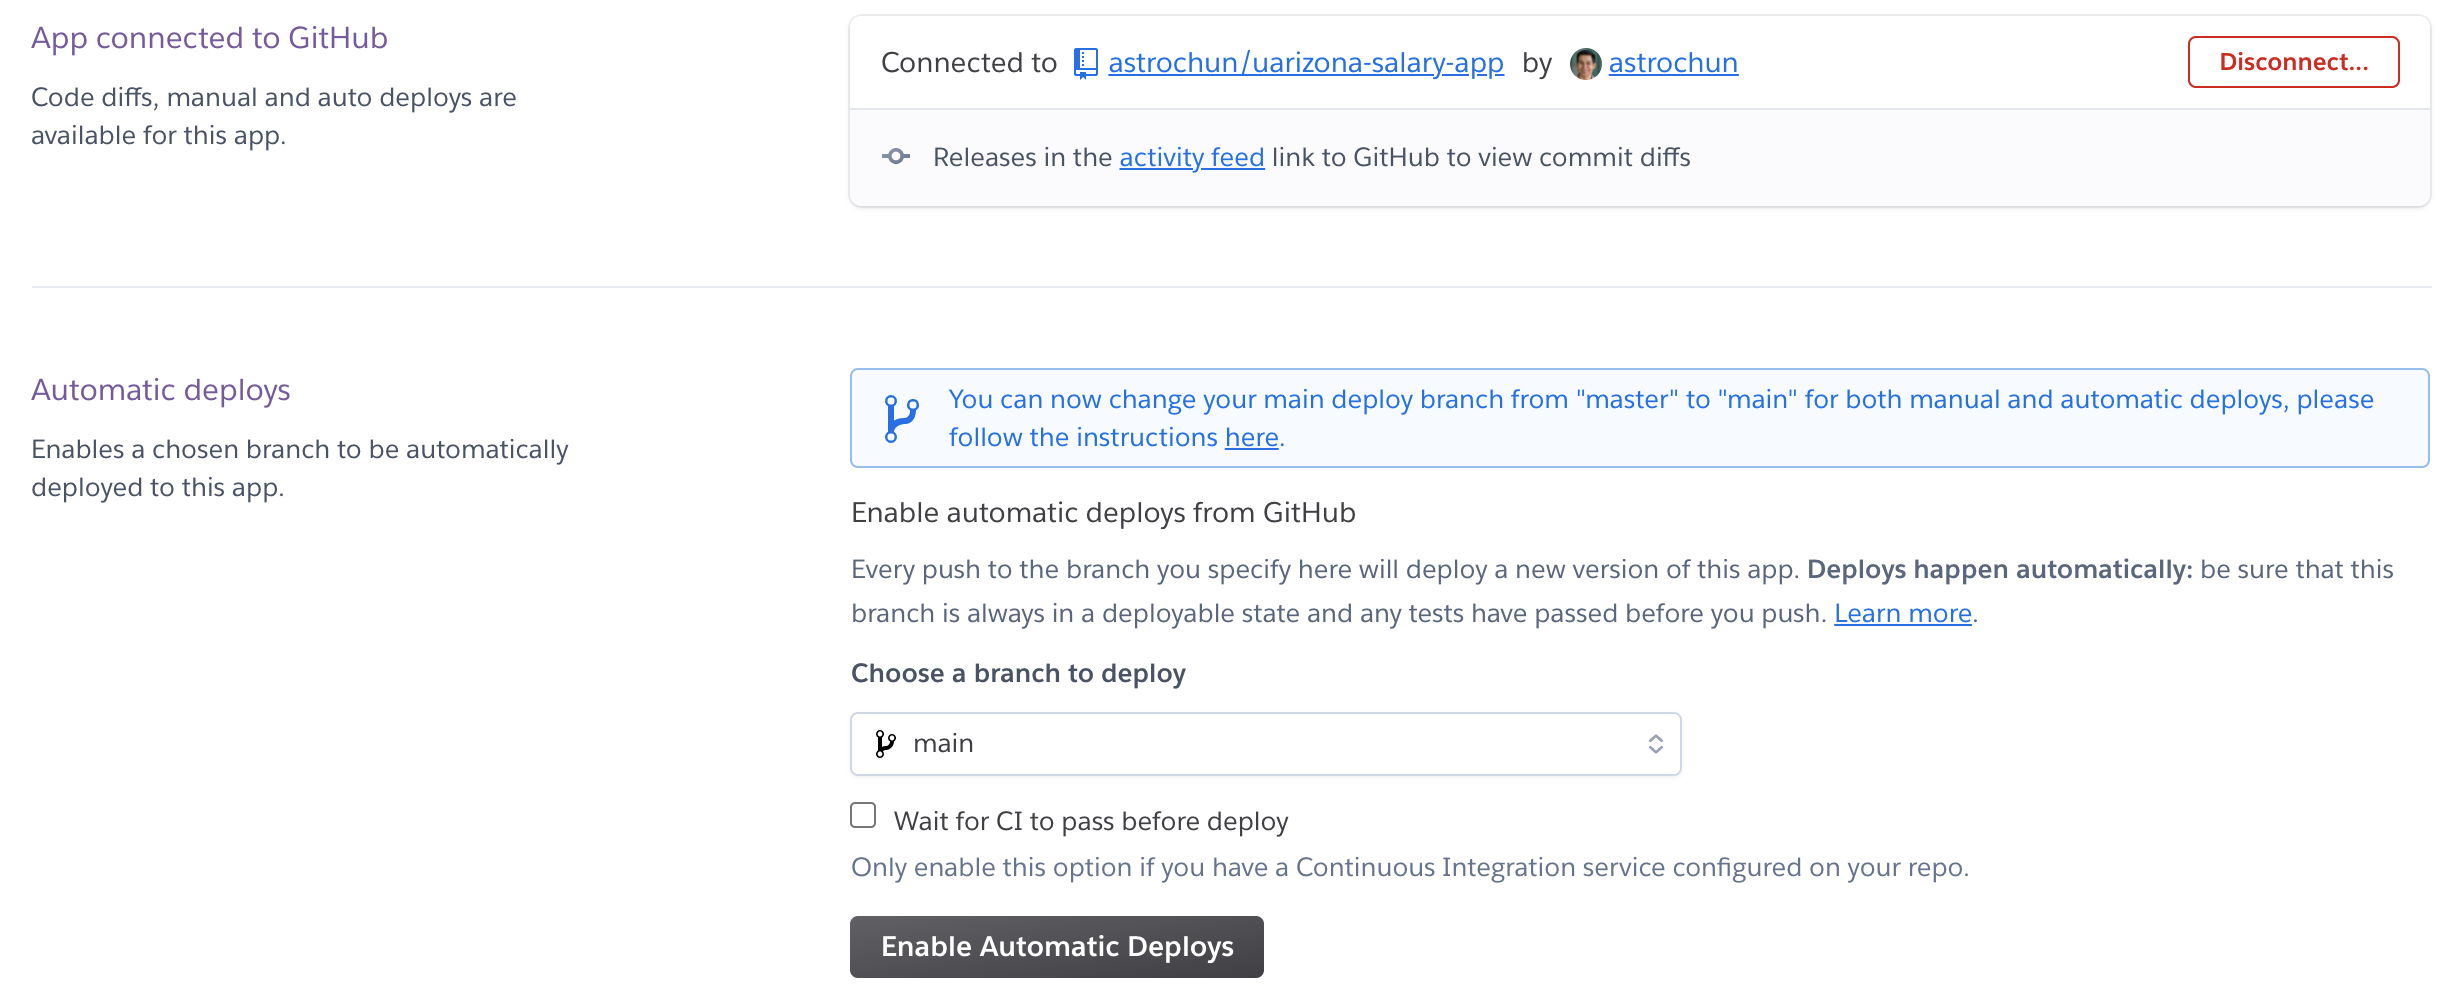
After you connect your Heroku app with your GitHub account, you can easily enable CD with the “Enable Automatic Deploys” button.
While this is great, I realized that this will re-deploy with any changes to the GitHub repo. That is, even a simple change to the README.md or the CHANGELOG would trigger a new deployment. Thus, a bit of control over deployment is still needed.
While developing this app, I followed a GitHub workflow where I created a new
branch which is then merged into the main branch through a pull request
(PR). To distinguish changes to the code from other changes that does not
impact end users, I performed a git tag which is related to a version
bump of the codebase. The advantage here is that I can easily trigger
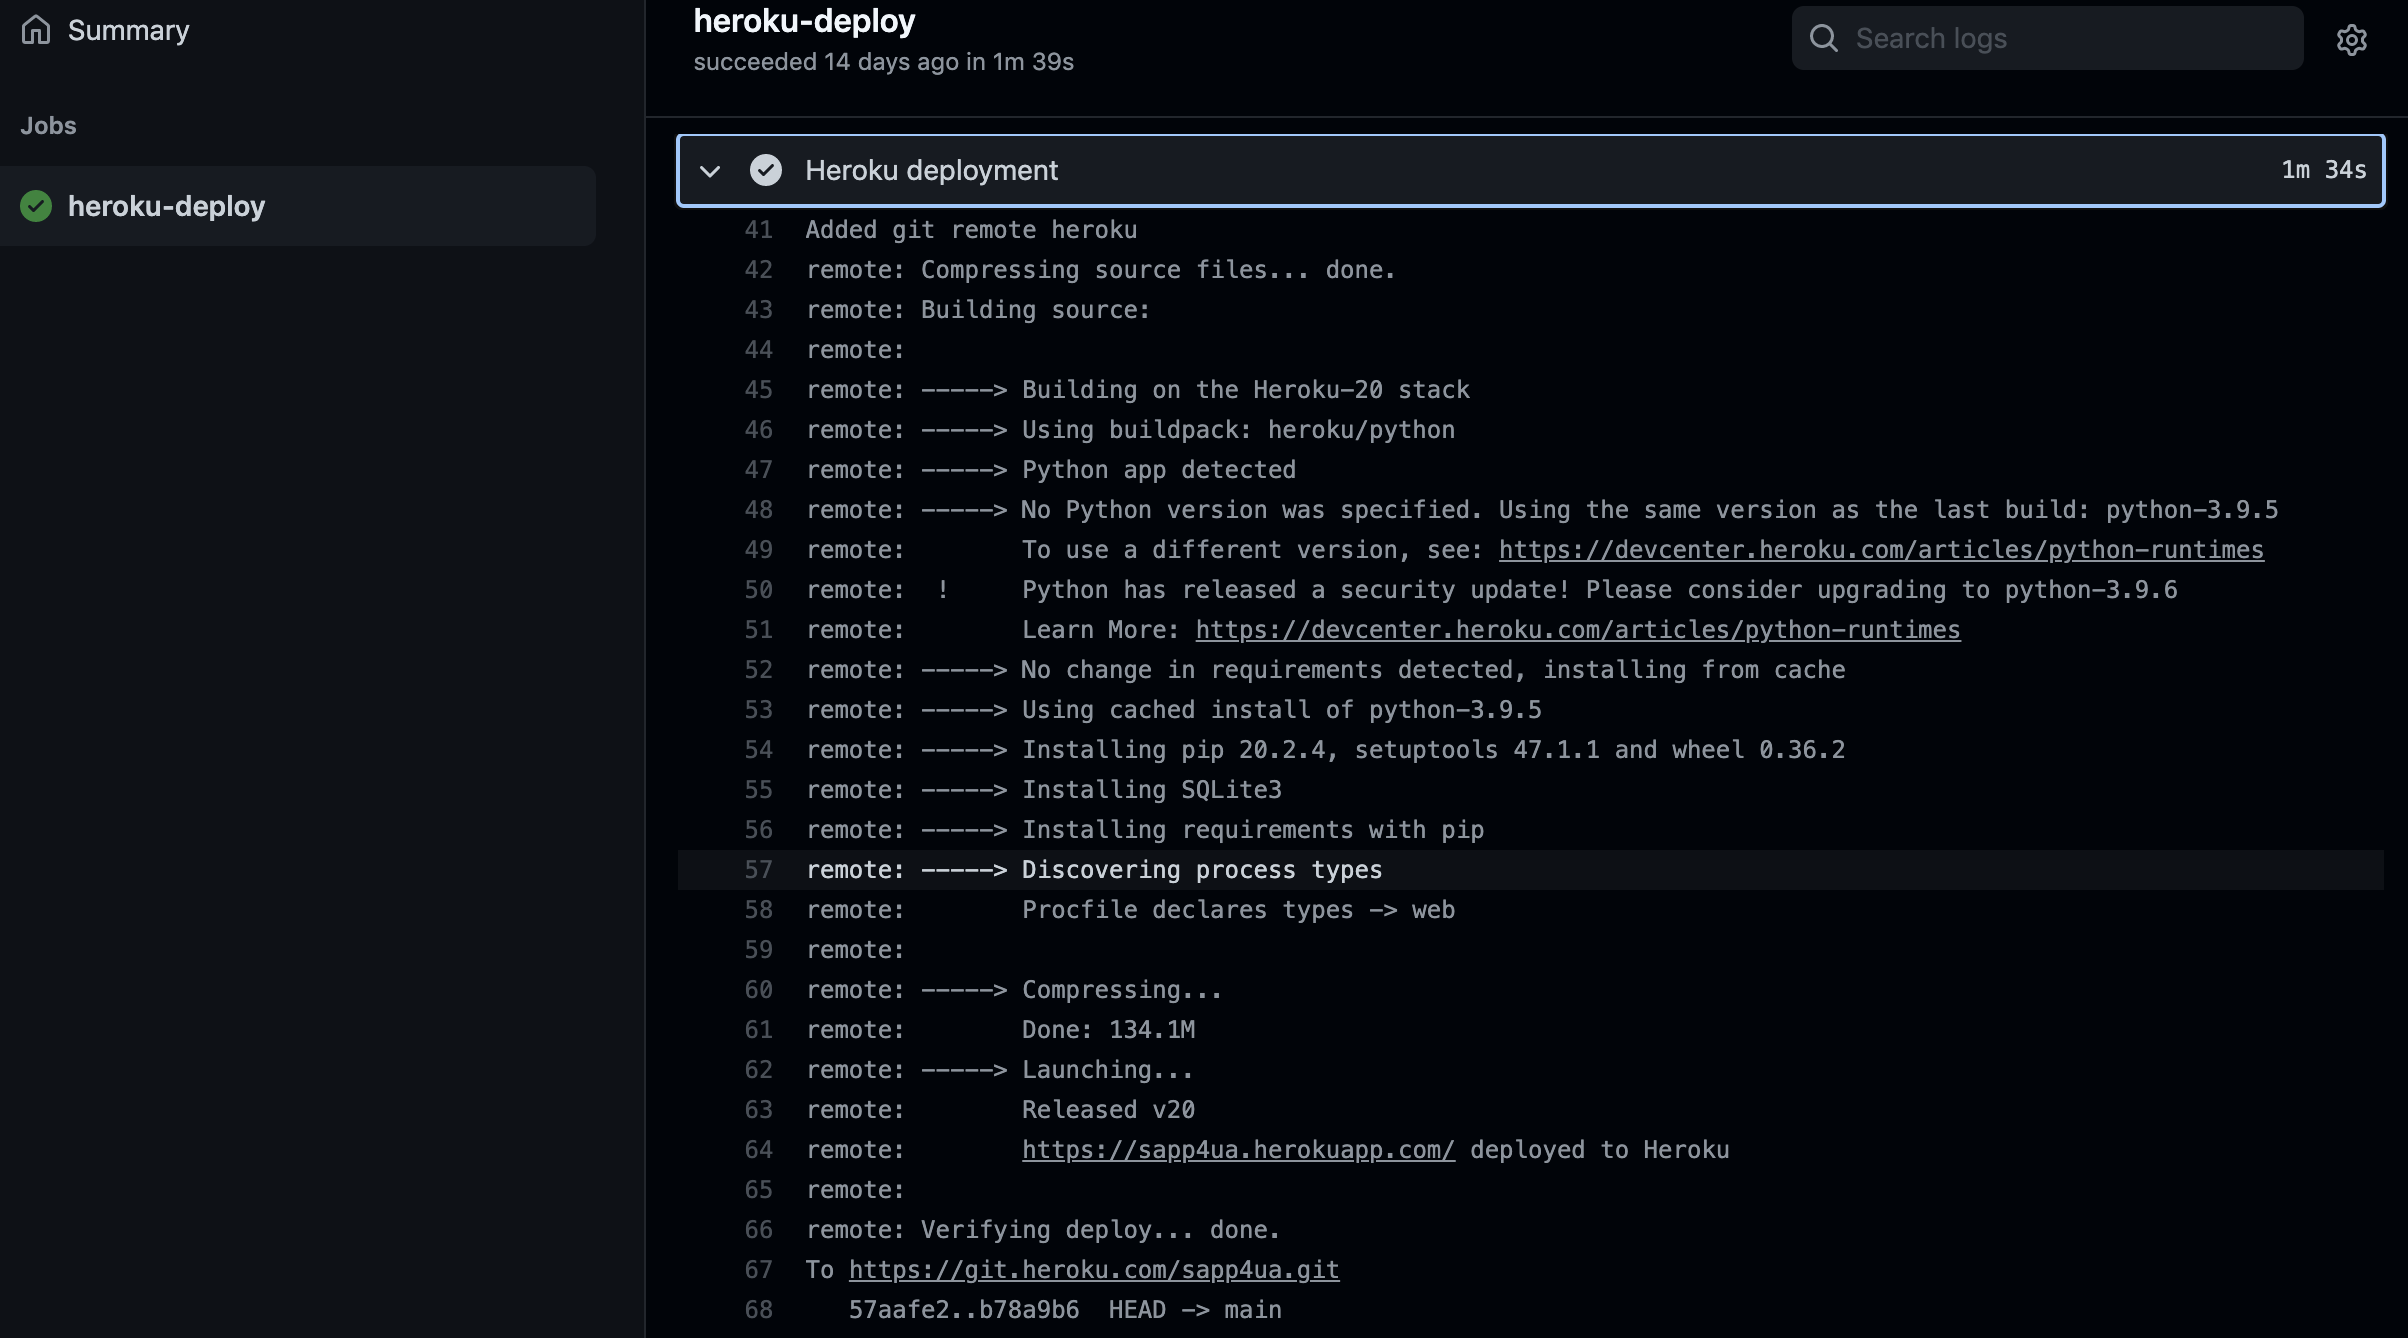
deployment based on a new tag using GitHub Actions:
name: Heroku Deployment

on:
  push:
    tags:
      - 'v*'

jobs:
  heroku-deploy:
    runs-on: ubuntu-latest
    steps:
      - name: Checkout
        uses: actions/checkout@v2
      - name: Heroku deployment
        uses: akhileshns/heroku-deploy@v3.12.12
        with:
          heroku_api_key: ${{ secrets.HEROKU_API_KEY }}
          heroku_app_name: "<project-name>"
          heroku_email: "myemail@dot.com"
You will need to create a Heroku API token (it's in the “Account Settings” option of your Heroku account) and add it as a secret in the GitHub repo. With the above workflow, I can easily trigger a deployment using
git push --tags
And that's how I built a streamlit app that I easily deployed on Heroku
for free!
What's important for end users?
Recently I asked users for the next feature they would like to see. With 40% of the vote, users felt that having a search tool to look at individuals’ salary data would be great.
.@uarizona salary app is all about the experience of the users, so help me prioritize what's the next 😎 feature for 🚀!https://t.co/sPs8xmkTbz@CAJUArizona @UCWArizona @coba_uarizona
— Chun Ly, Ph.D. (@astrochunly) June 22, 2021
This data view is now available and even has the option to search for all individuals in a department.
What's next?
More data views!
In 2020, UArizona completed the University Career Architecture Project (UCAP), which map every employee to specific career streams. I recently submitted a public request for FY2020-21 data that includes UCAP and other demographics (e.g. sex, race, ethnicity). In fact, UCAP was my original motivation for this app. With a proper mapping of career streams, any UArizona member could easily compare their salary against those across the campus with the same job responsibilities.
Once I have these data, I'll then add additional views to explore the UCAP classification and other demographics.
Support it!
If you found this open-source software or this tutorial post useful, consider sponsoring me through GitHub with a small donation. Your name will be included as a sponsor on the app's main page!